Segment with eScriptorium
This section introduces the segmentation panel and some related features. The segmentation panel is one of the panels available in the “Edit” tab, once you are in a document ({base_url}/document/{document-id}/images/).
The segmentation panel is toggled by clicking on the “Segmentation” button at the top of the page (or by pressing ⌃Ctrl+3).
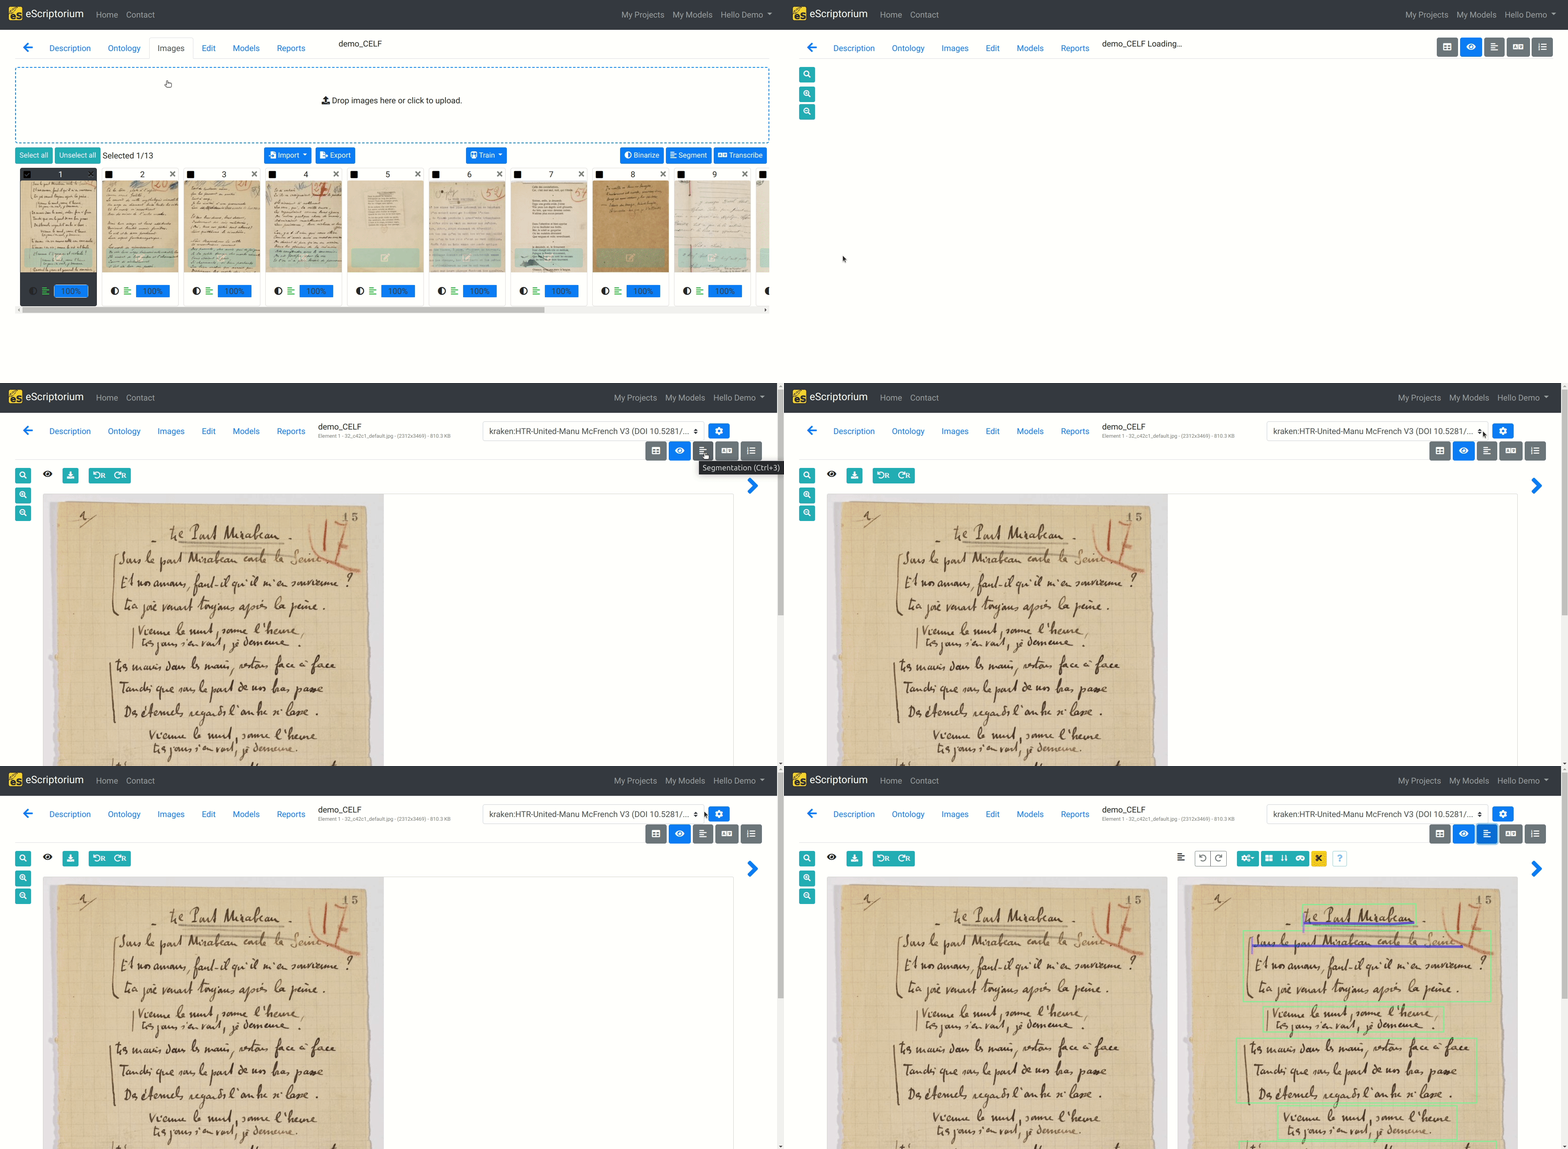
Forewords on segmentation
Many names
What we refer to with “segmentation” in the following page can also be called many names: zoning, layout analysis, document analysis, optical layout analysis, etc.
Segmentation refers to two parallel processes:
-
at line level: precisely detecting the location of lines of text in an image. Each line is called a “segment” and this step is mandatory in eScriptorium for transcribing said lines later.
-
at region level: extracting and labeling the physical/logical structure of an image by identifying blocks of pixels. Each block is called a “region” or a “zone”. The goal is to divide the document into meaningful regions that can be further processed or analyzed. This step is optional for transcription, but can be important for later post-processing tasks.
Additionally, lines and regions are ordered: usually from top to bottom, but indents and multiple columns can cause surprising results.
Regions are useful to logically organize the segments: lines can be associated to a region (meaning the lines are contained in the region and form a logical/physical group) or they can be “orphan lines”. Likewise, regions can be empty, meaning they are not associated with any line. When lines are associated to a region, their reading order is calculated within a group of lines belonging to the same region.
One of the reasons why segmentation, be it at line level or region level, is very powerful for later post-processes is because each line and region can be “labeled” or “typed”. It makes it possible to distinguish between regions identifying a paragraph of text, images, tables, columns, headings, footers, etc.
Segmentation can result from a prediction, can be performed manually, or can be imported with the import button when you import an XML file directly from the Images tab inside a document.
Complete segmentation before transcribing
You should make sure that your line segments are correct before moving on to transcribing. Otherwise, you risk having to erase some of your transcription while correcting the segmentation.
Region segmentation
In the following example, we segmented and labeled the zones that bear a semantic role for our comprehension of the text. We are dealing with a poem, so we drew with eScriptorium bounding boxes around the page number (in blue), the title (in purple), and the stanzas (in green).
However, you could have decided to annotate the layout more precisely. For example, the printed page number on the top right corner could have been annotated too. It is up to you to decide how deep you want to go into the text regions segmentation, depending on your needs.
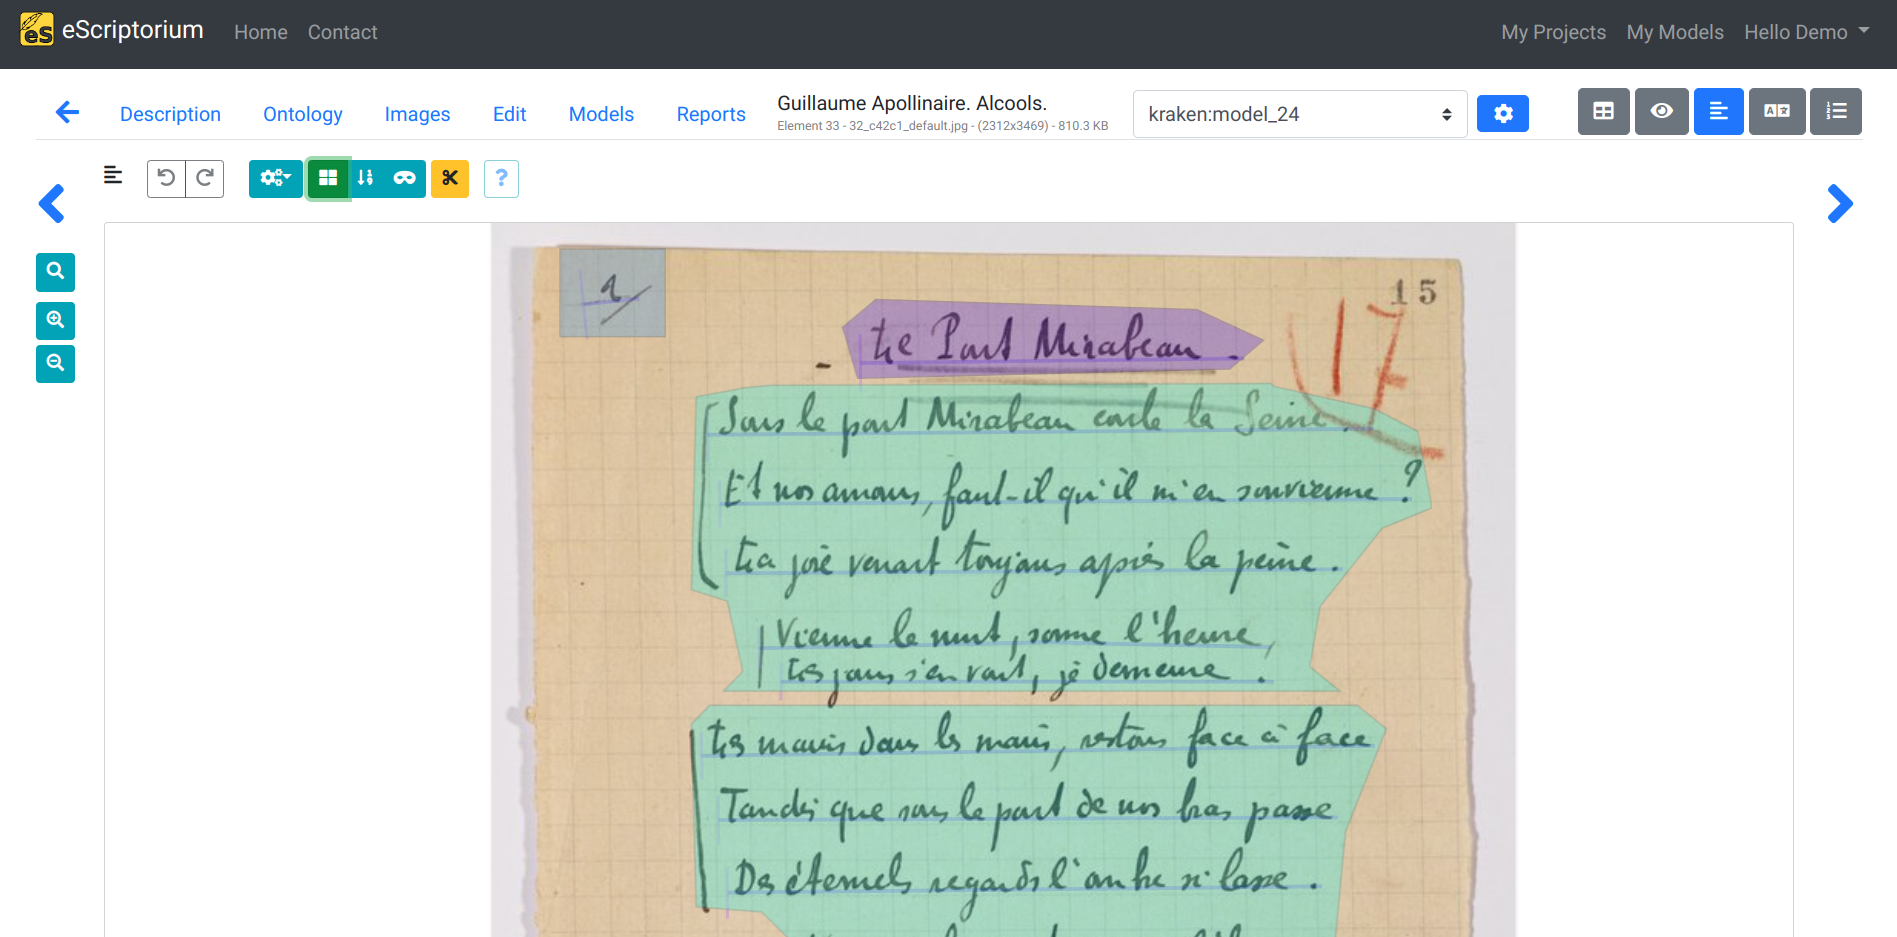
Segmenting text regions with eScriptorium
Note
We show here how to manually create segments, but it is possible to automatically perform regions segmentation with a machine learning model!
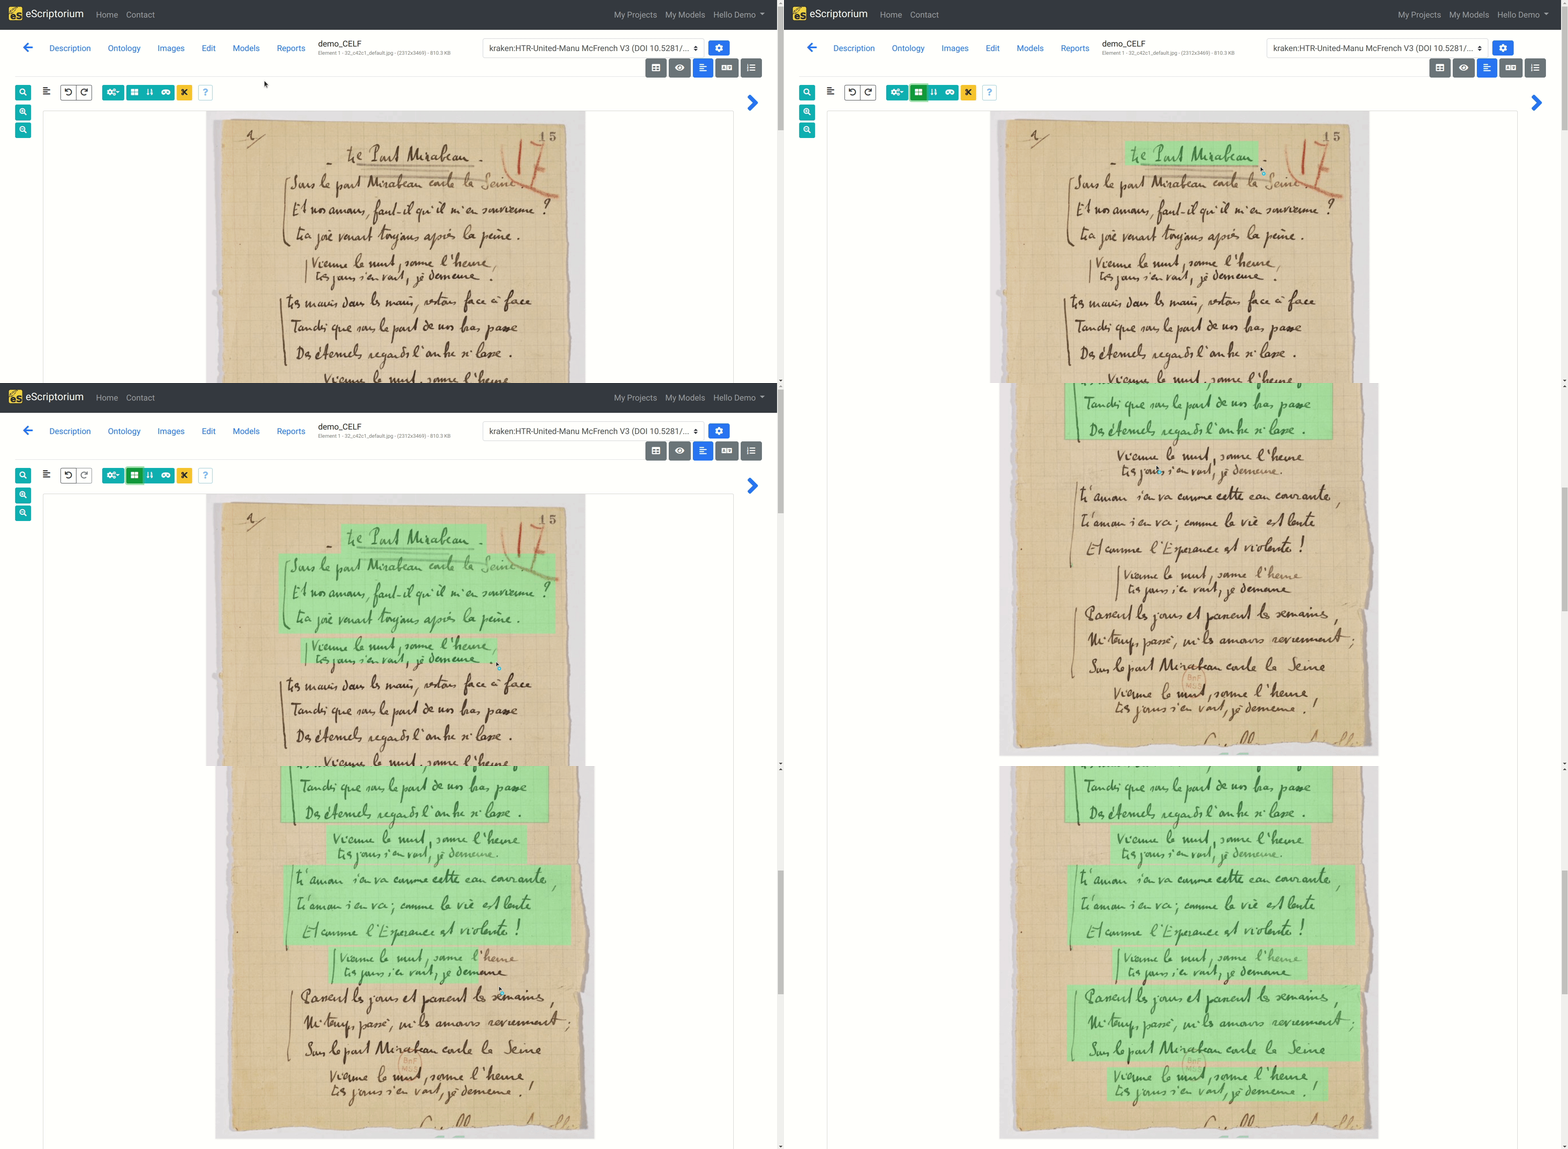
You can manually draw bounding boxes inside the Segmentation panel. To do so, switch from baseline editing mode to region mode, by clicking the mosaic button, or by pressing R.
You can now draw bounding boxes on the image, covering the portion of the image you want to annotate. To draw a rectangle, click on where you want one of the corner and then where you want the opposite corner. You draw green rectangles by default.
You can modify a text region by clicking on it to make it “active”. Once active, the region will be displayed with little white squares symbolizing the points (or vertexes) of the polygon. You can click inside the polygon, close to a point and hold and drag your mouse to move the closest point. This allows you to draw the shape you want.
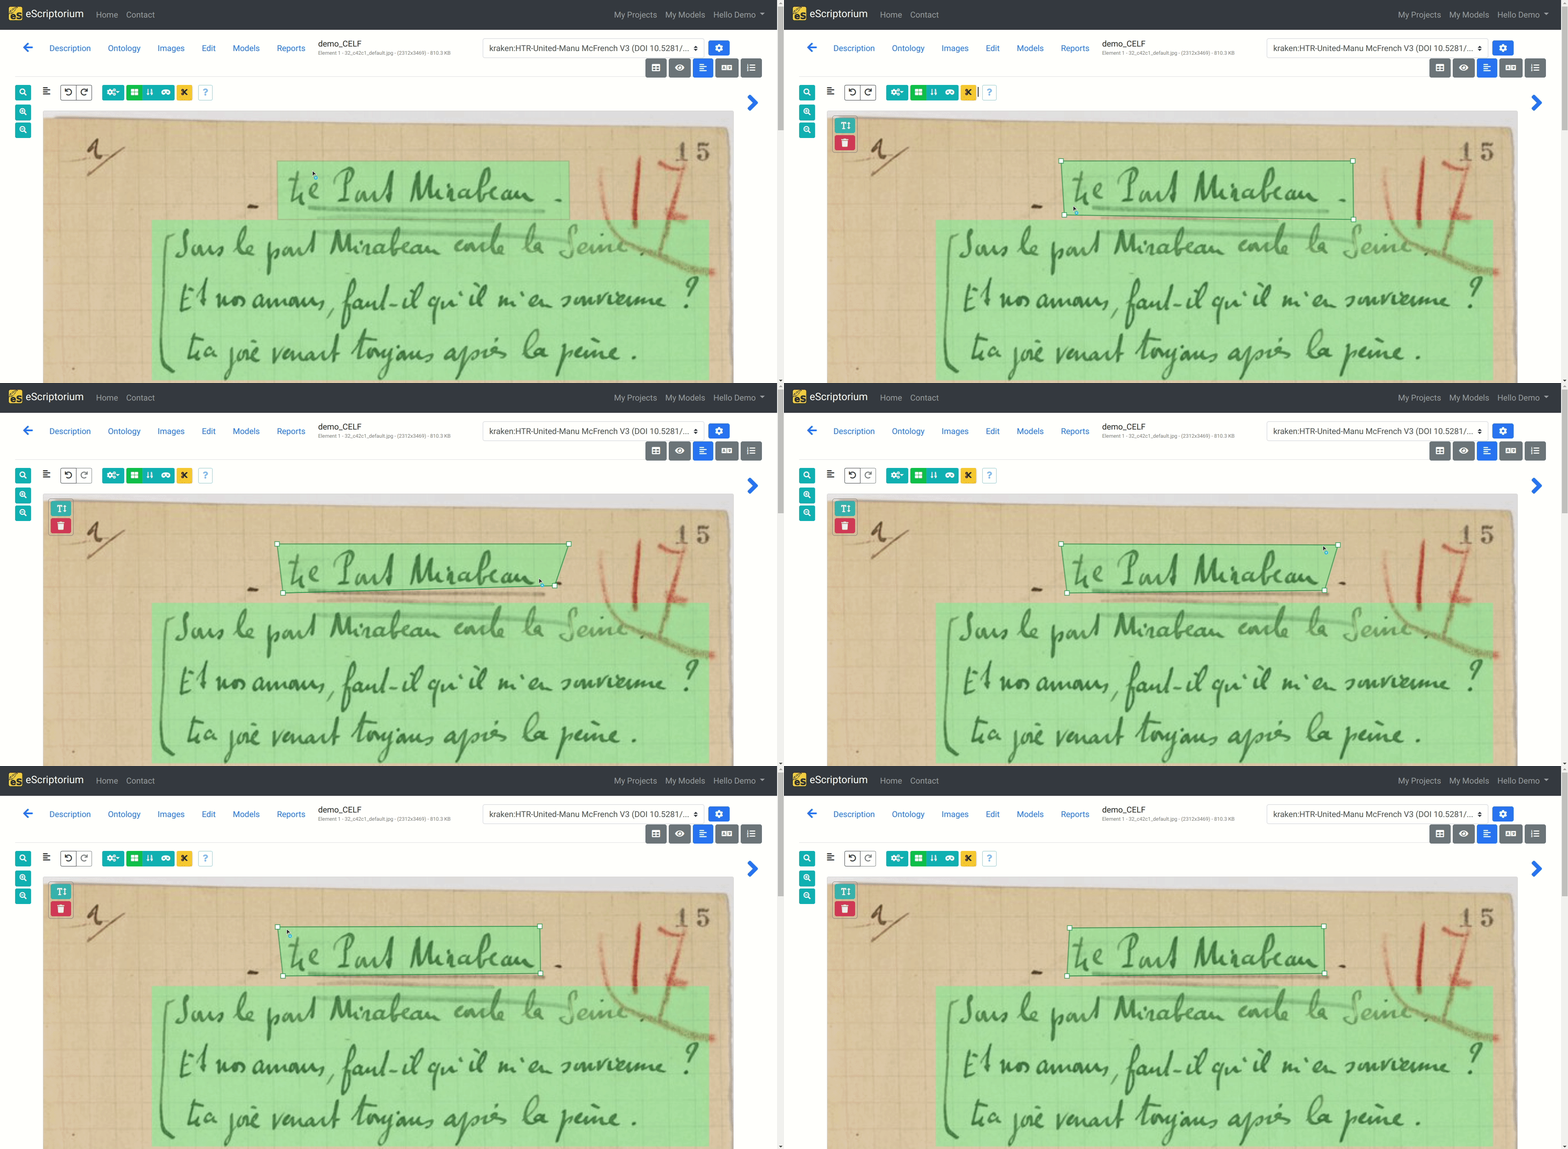
You can delete an active region by clicking on the red trashcan button, or by pressing ⌦ Del.
More features
Several common shortcuts available in vectorial drawing software like GIMP or Adobe Illustrator can be used in the segmentation panel when drawing or modifying regions OR lines. Some of them are described in the “Text line segmentation” section. You should check it out.
Tip
All advanced features are described in a help window, just click on ? in the Segmentation panel.
You should also check the shortcut page in this documentation!
Note
It is possible to create nested text regions or to have several regions overlapping. Note, however that this may cause strange behavior when you want to associate a series of lines to their corresponding regions, and above all that it is not possible to efficiently train a segmentation model to produce overlapping regions: currently kraken segmentation models are not able to assign more than one type to a pixel.
Text line segmentation
Text line segmentation is a mandatory step in eScriptorium in order to transcribe a document: you cannot have a transcription without first defining the text segment to transcribe.
In eScriptorium, segments are made of two elements:

-
a baseline (here in red), or a topline, which is a defined by at least two points. It is the virtual line on which the text is written, or from which it is hanging.
-
a mask (here in purple), which is a polygon defined by at least three coordinates points. It delimits the area of pixels containing the text, for a given baseline or topline. It is automatically calculated by eScriptorium.
Draw baselines or toplines
Deactivate region mode
First of all, make sure you are not in “region mode”: the mosaic button should be blue and not green and clicking on the image should make you draw blue lines instead of green rectangles. If there are any region drawn on the image, they should appear as colored outlines in stead of fully colored rectangles.
To deactivate the “region mode”, click on the mosaic button, or just press R.
Note
We show here how to manually create segments, but it is possible to automatically perform text lines segmentation with a machine learning model!
To segment text lines, do the following:
- Click on the image where you want the line to start and then click on the image where you want the line to stop. It will create a simple line passing through two points.
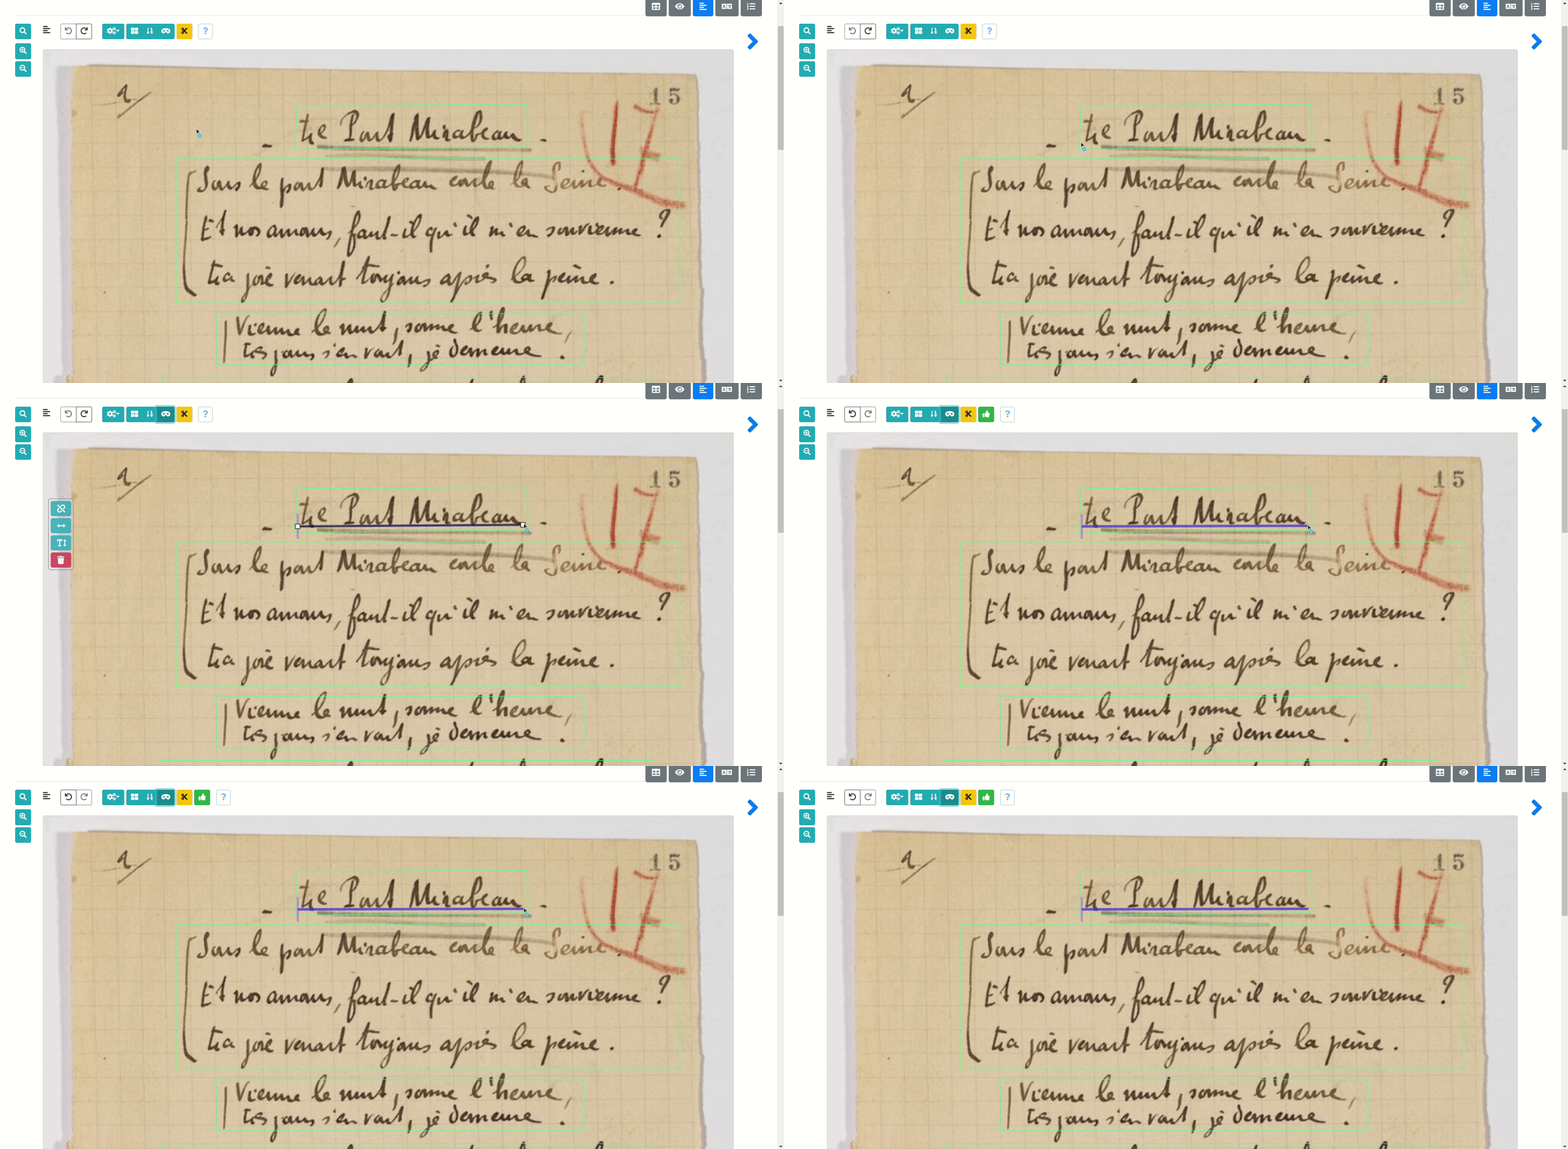
- If your text is not straight, you can add more points afterwards by clicking once on the line to make it “active”, then by double-clicking, still on the line, where you want the new point to be drawn.
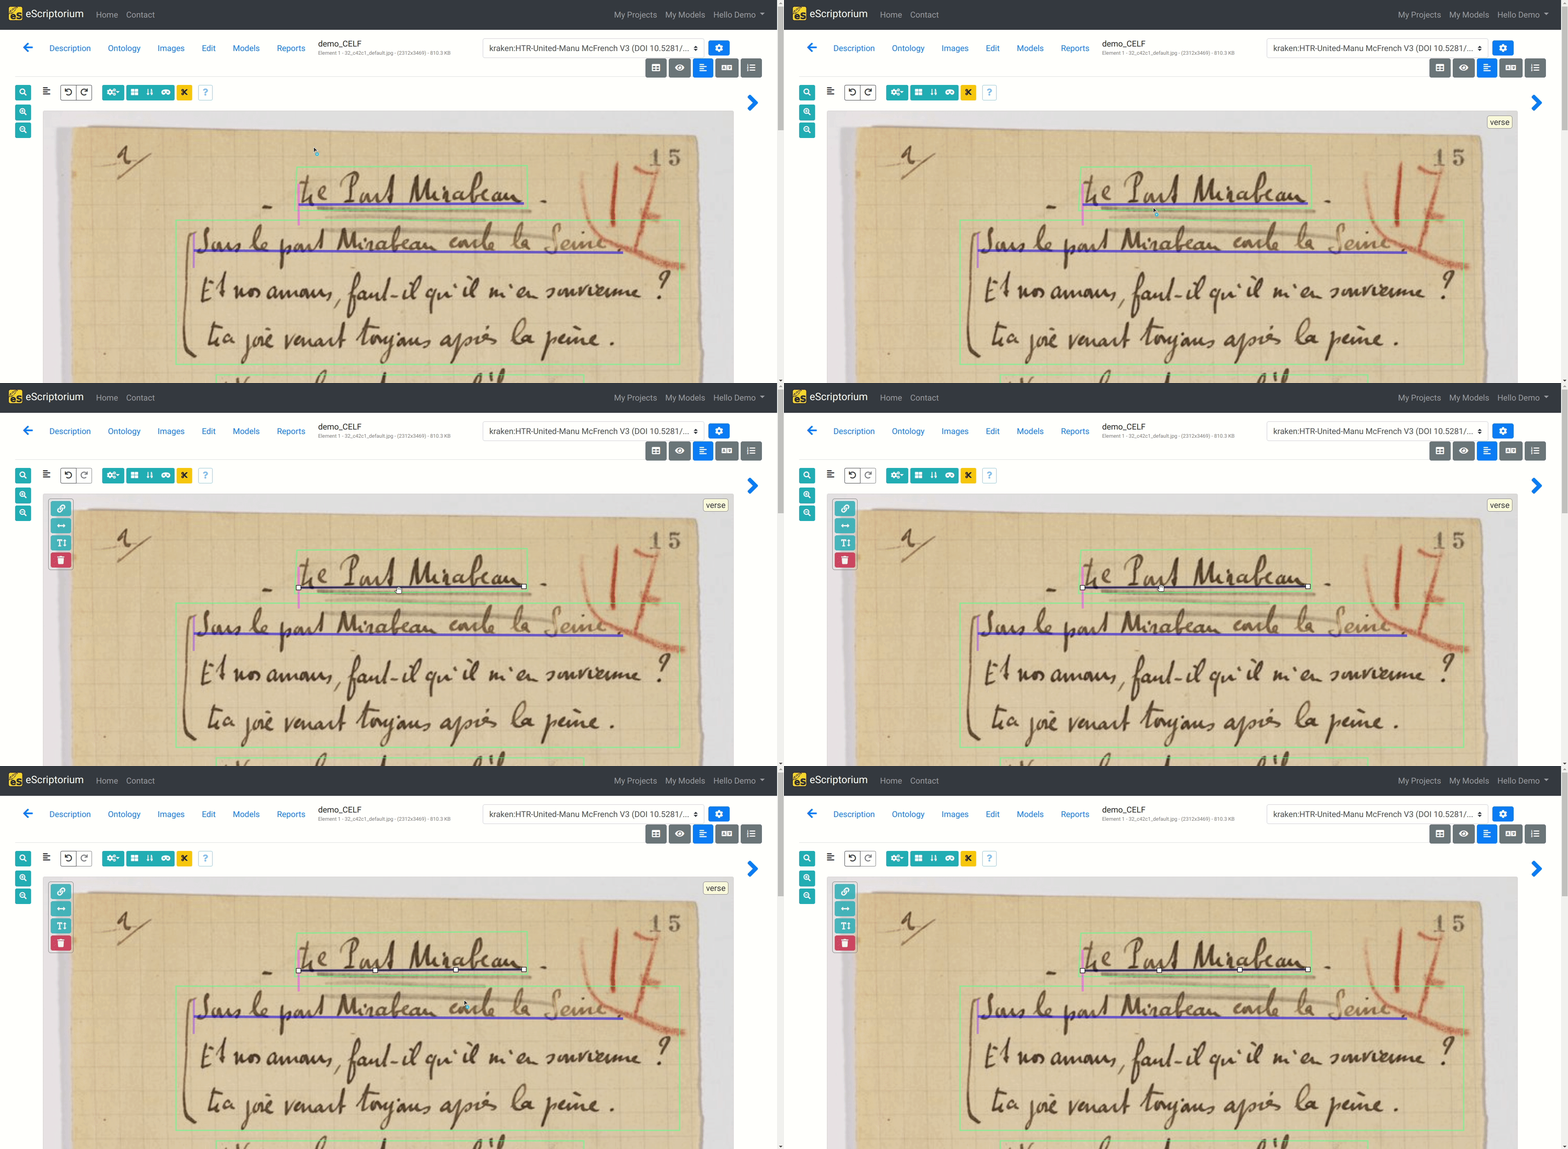
- While the line is active, you can move a point with a simple click and drag: it will move the closest point, allowing you to adjust the line to the text.
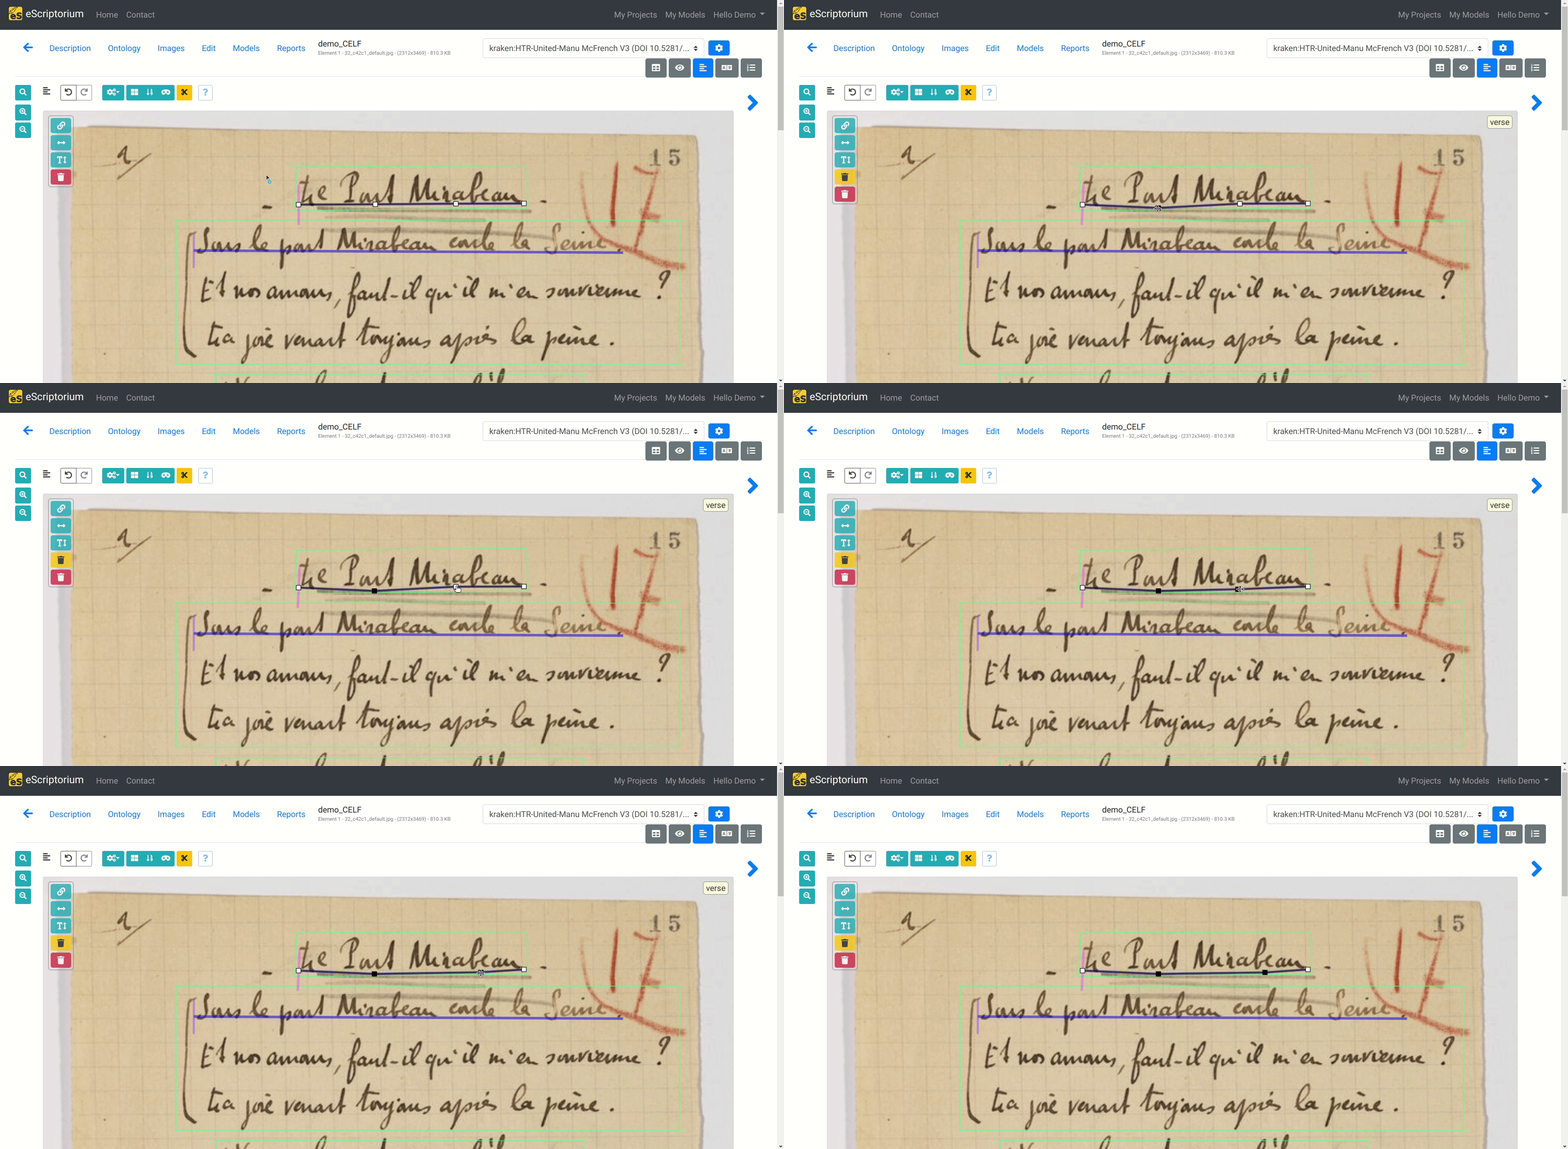
Other line manipulations include:
- Deleting a point in an active line by clicking on it, then click on the yellow thrashcan button or press ⌃Ctrl+⌦ Del. Be careful, clicking on the red trashcan or press ⌦ Del will delete the whole line and not just the active point.
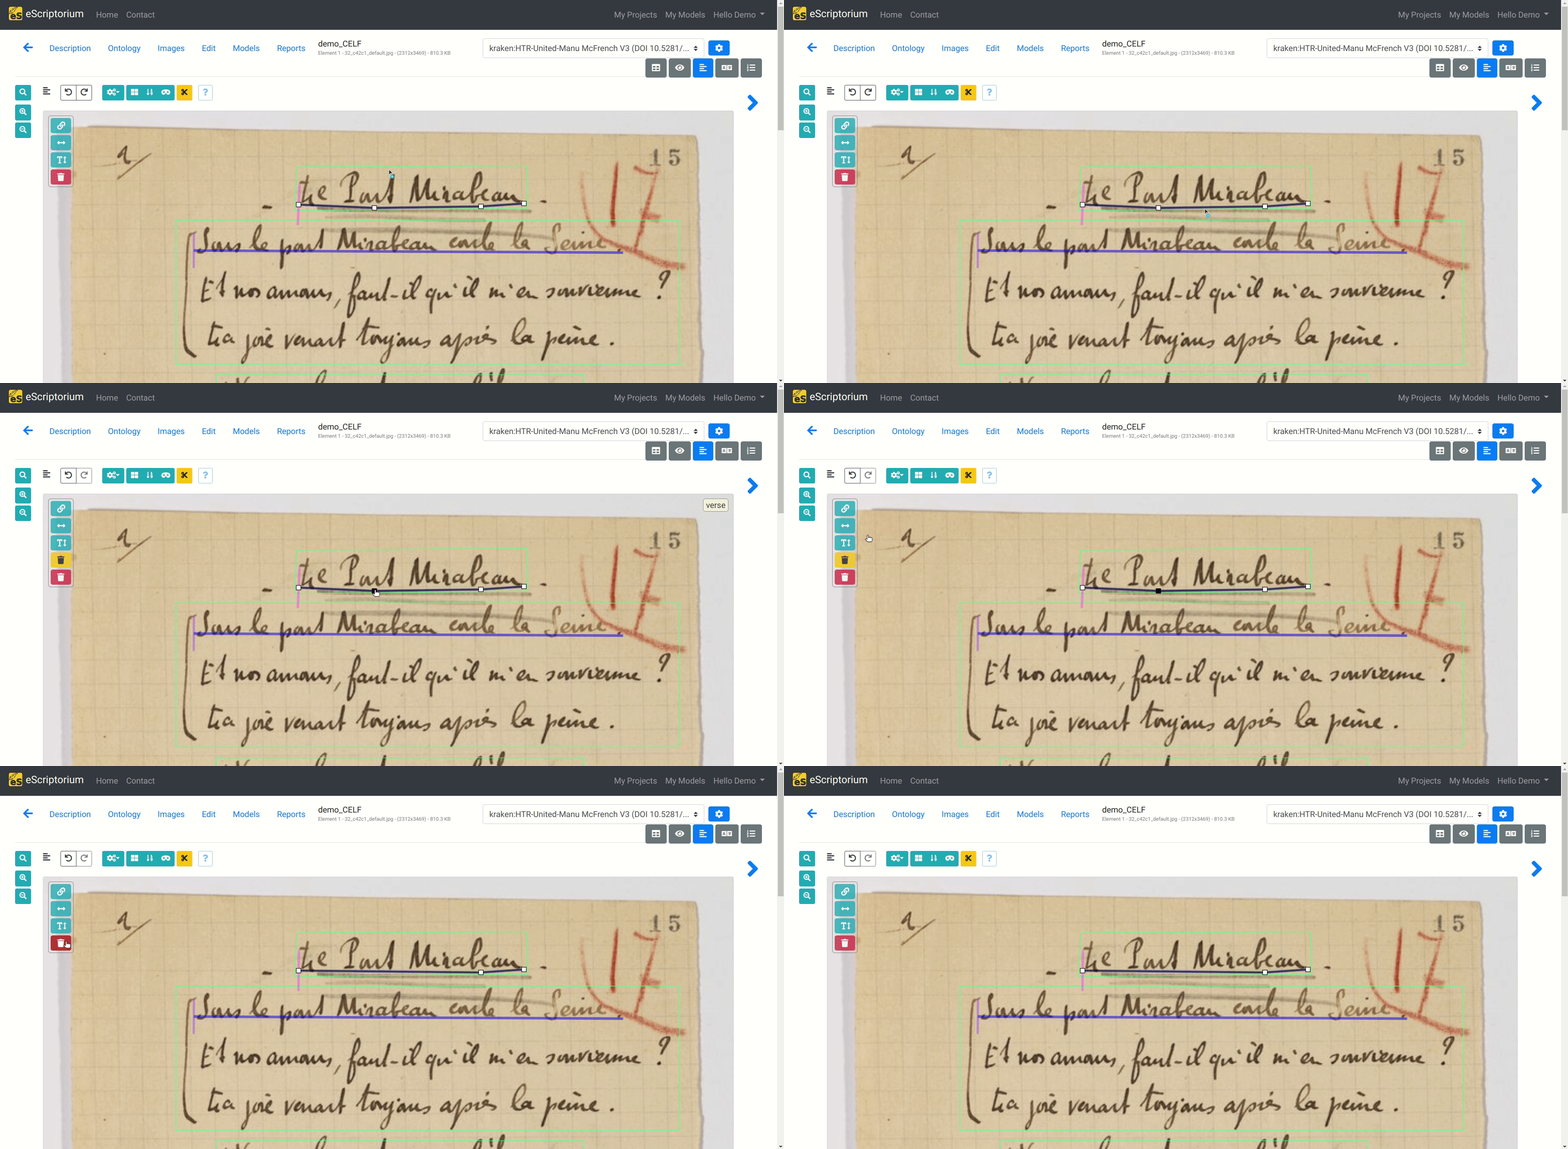
More dexterity to activate a point
Selecting/Activating a point can be difficult (click quite not exactly on it and you start drawing a new segment…). This is why you should know that the lasso technique will make you life easier: make sure your line is active, then hold ⇧ Shift and click and drag on the image to create a selection rectangle over the squares you want to select. Once active, they will appear in black.
- Cutting through one or several text lines using the scissors tool (C). This is particularly helpful for documents with multiple columns. But, you will only be able to draw a straight rectangle so if your image is skewed, it will require more work.
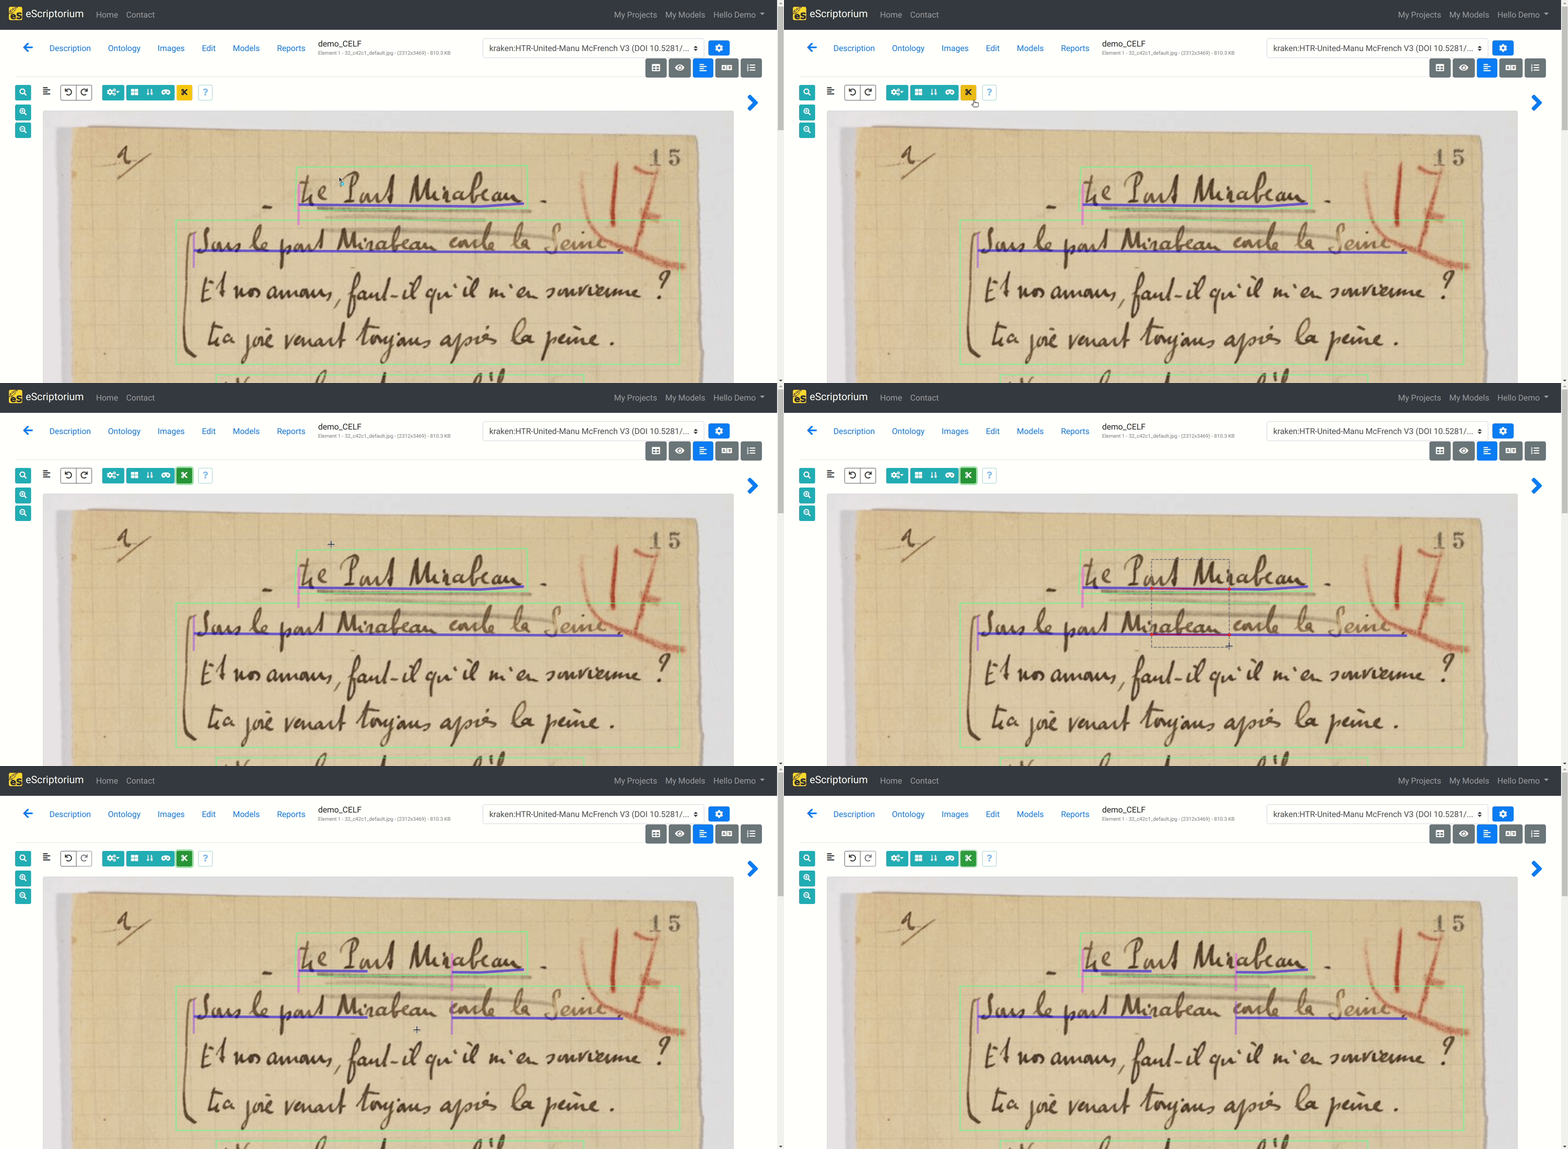
-
Inverting the reading direction of a line by selecting it, then clicking on the reverse selected lines button or by pressing I (not available for regions).
-
Merging two or more active lines by clicking on the join selected lines button or pressing J (not available for regions).
Tip
All advanced features are described in a help window, just click on ? in the Segmentation panel.
You should also check the shortcut page in this documentation!
Draw the masks
By default, only the baselines are shown in the “Segmentation” panel: you can toggle the display of the masks by clicking on the “mask button” (shortcut M). Masks appear as more or less complex polygons, sometimes missing the highest or lowest part of the letters, or missing diacritics.
eScriptorium asynchronously calculates the mask associated with each segment. When it is the first time that a line is manually drawn on an image, you have to manually trigger the mask calculation. The reason is to let you finish drawing all the baselines you want before starting a background job. When mask calculation is not automatically active, a thumbs up button will appear at the top of the panel. Simply click on the thumbs up button to start it.
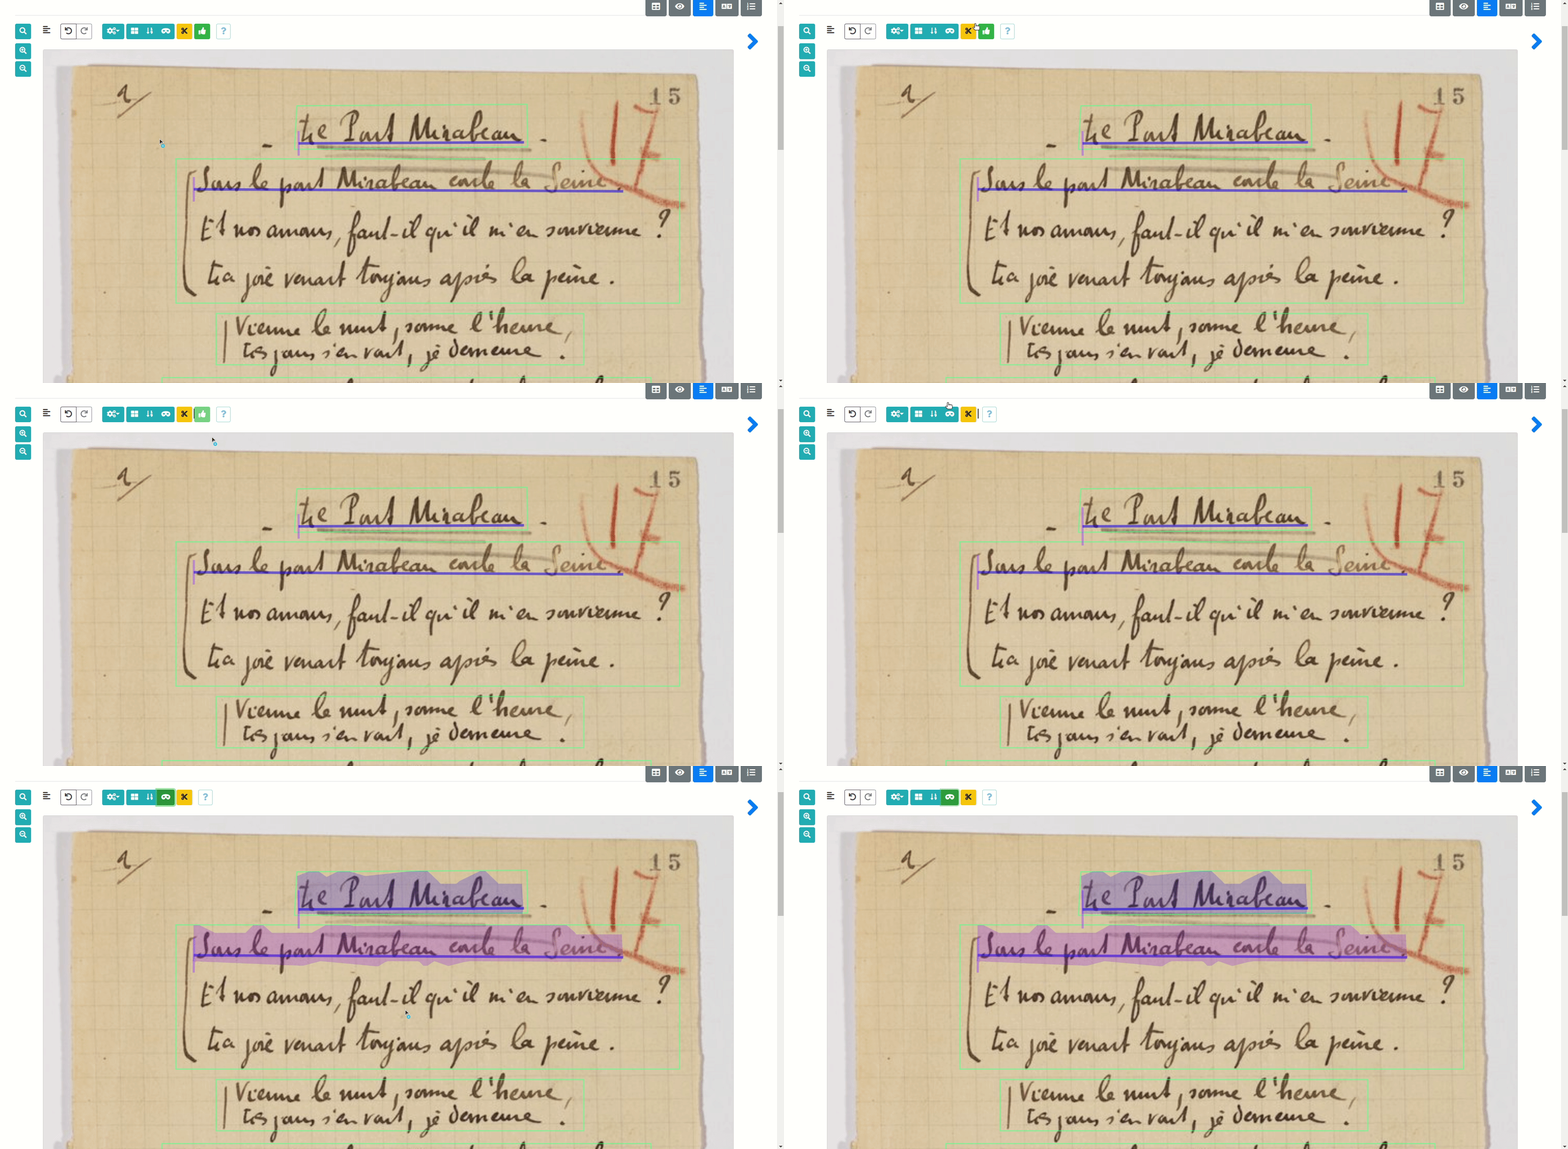
Don’t fix the masks
Unless you have a good reason to, it is not recommended to manually modify the masks: it would be a tedious task and the risk of the modifications being overwritten by an automatic mask calculation is too high.
Reordering lines
As mentioned above, regions and lines are ordered. The reading order of the text lines is calculated automatically as a background task (asynchronously). There are two ways to control the line order:
-
You can display the reading order of the lines on the “Segmentation” panel by clicking on the Toggle ordering display button or by pressing L.
-
You can also use the “Text” panel (shortcut ⌃Ctrl+5) where the transcription will appear as a succession of lines. Each line is associated to a number, corresponding to the reading order.
Reading order doesn’t affect the transcription task but it will affect how the text is exported. In some cases the reading order is crucial so you will want to control and correct it, while in other cases it is not important or not necessary.
Fix reading order last
It is possible to fix the reading order at any time, before or after running the transcription task, but in general, it is recommended to do it only after you are done fixing the regions and the lines because in some versions of the software, creating, deleting or modifying a line will start an automatic recalculation of the reading order : you don’t want to work for nothing.
Manually modifying the reading order is done in the “Text” panel (where, after the transcription, reading order problems would be the most visible). Click on “Toggle sorting mode”: now a simple drag and drop is enough to carry out the modifications.
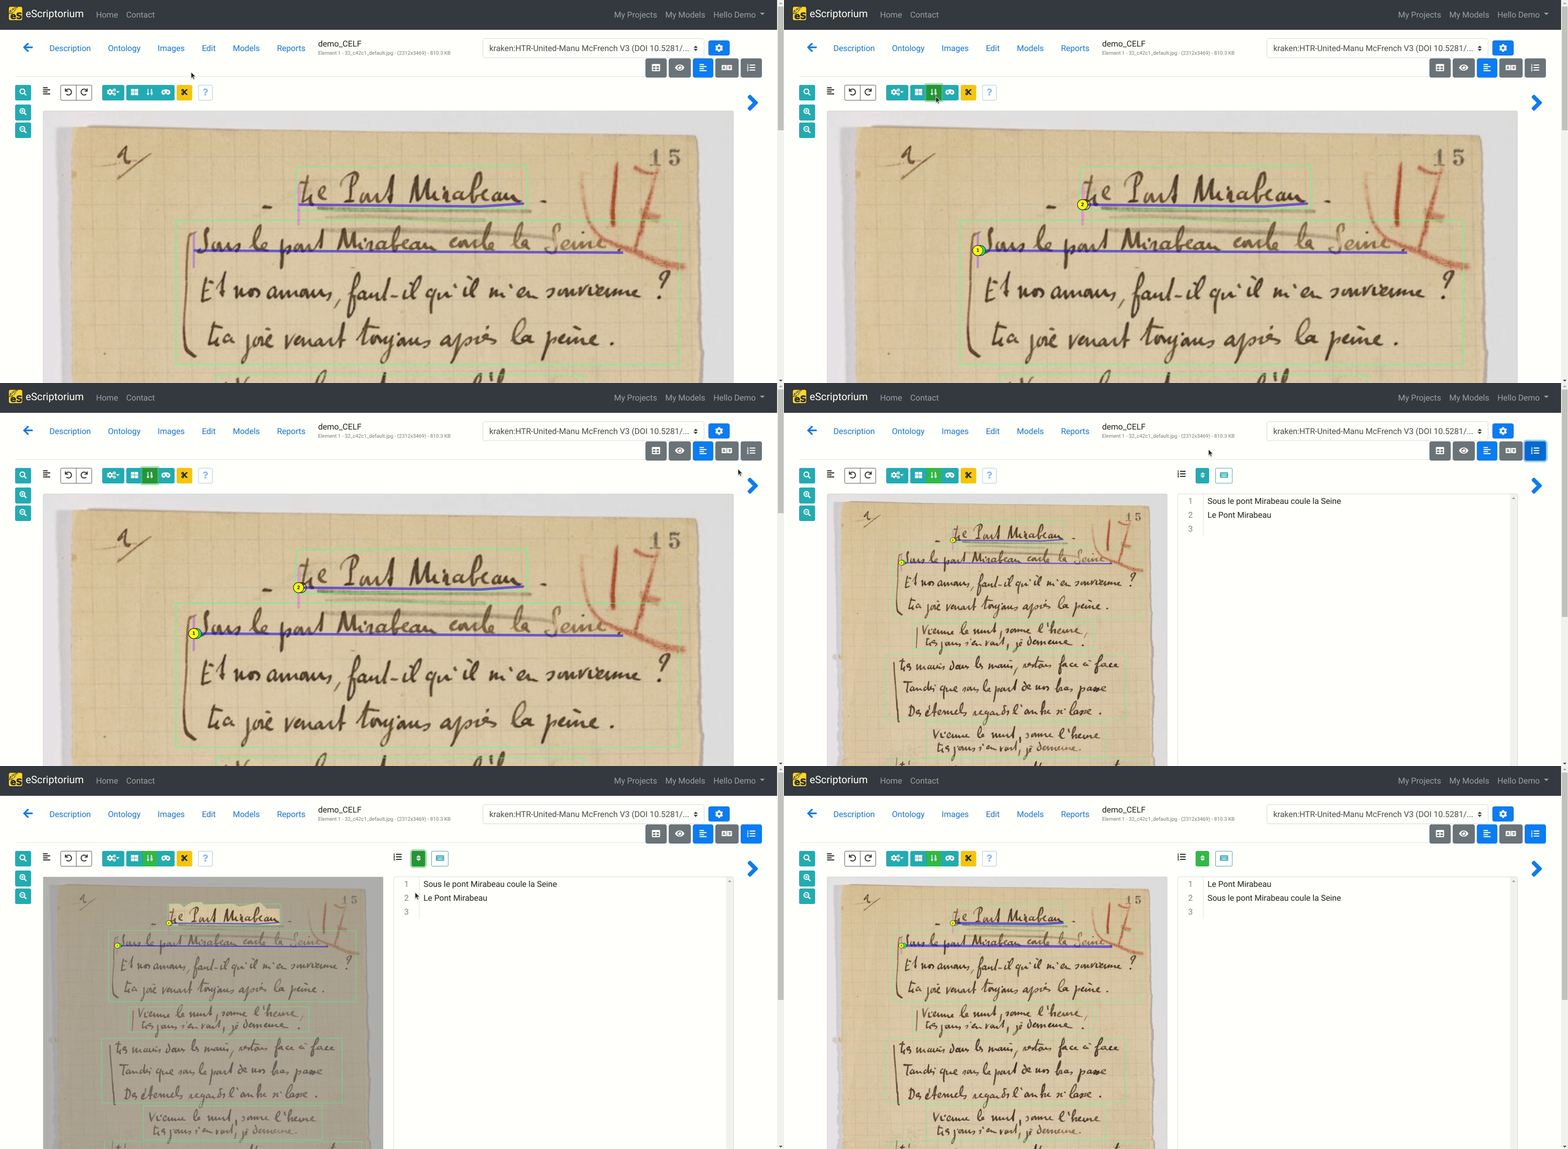
Associate lines to a regions
To associate a series of lines to a region, you must have drawn at least one region and a line and the line must be, for the most part at least, located inside the region.
In line segmentation mode, select one or several lines and click on the link selected lines to the background region, or press Y. You can do it for all the lines at once even if you have drawn several regions: the lines will be associated to the regions containing them.
If no region is drawn behind a segment, it will remain an orphan line.
You can revert this step by selecting lines and clicking on Unlink selected lines from their regions, or pressing U.
Using the Ontology feature and labeling lines and regions
Labeling lines and regions allows you to associate types to them. Labeling is handle at two levels:
-
defining the ontology (the terms available to type the line and regions), which is done outside of the Segmentation panel.
-
typing the lines and regions, which is done in the Segmentation panel.
Define the ontology
The ontology panel is one of the tabs you can access when you are working in a document (also accessible via {base_url}/document/{document-id}/ontology/).
Region types and lines types are defined in two different sections of the form.
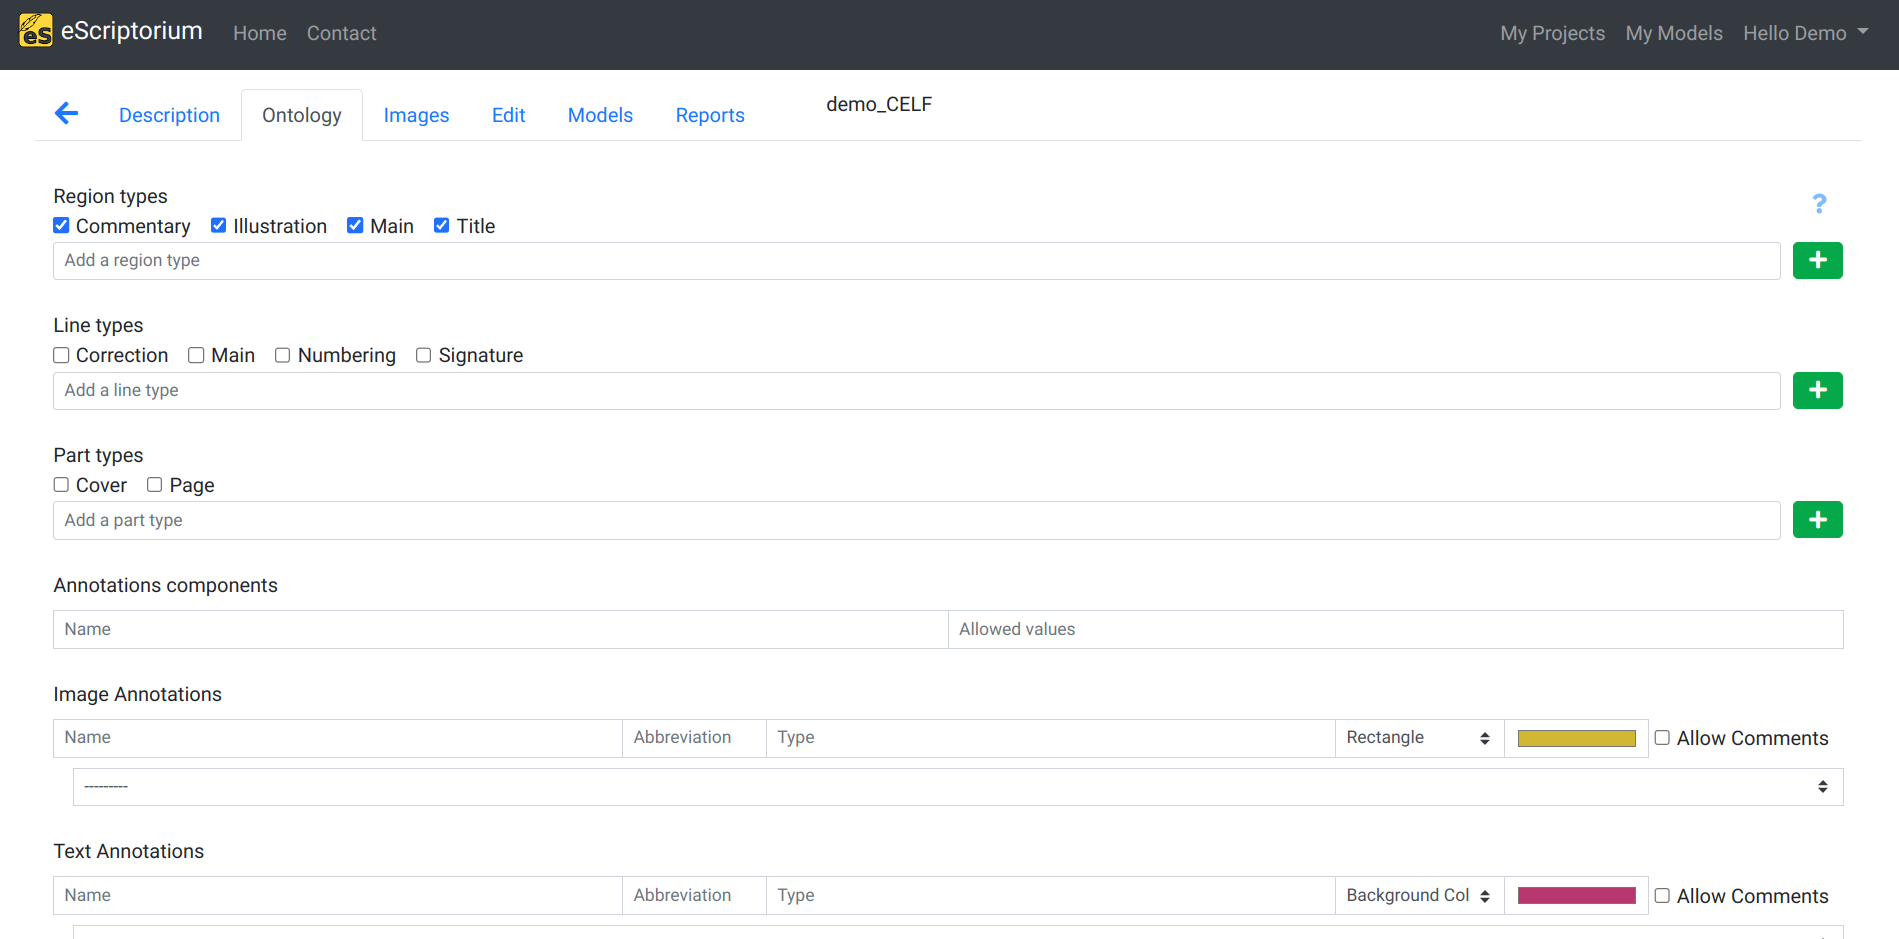
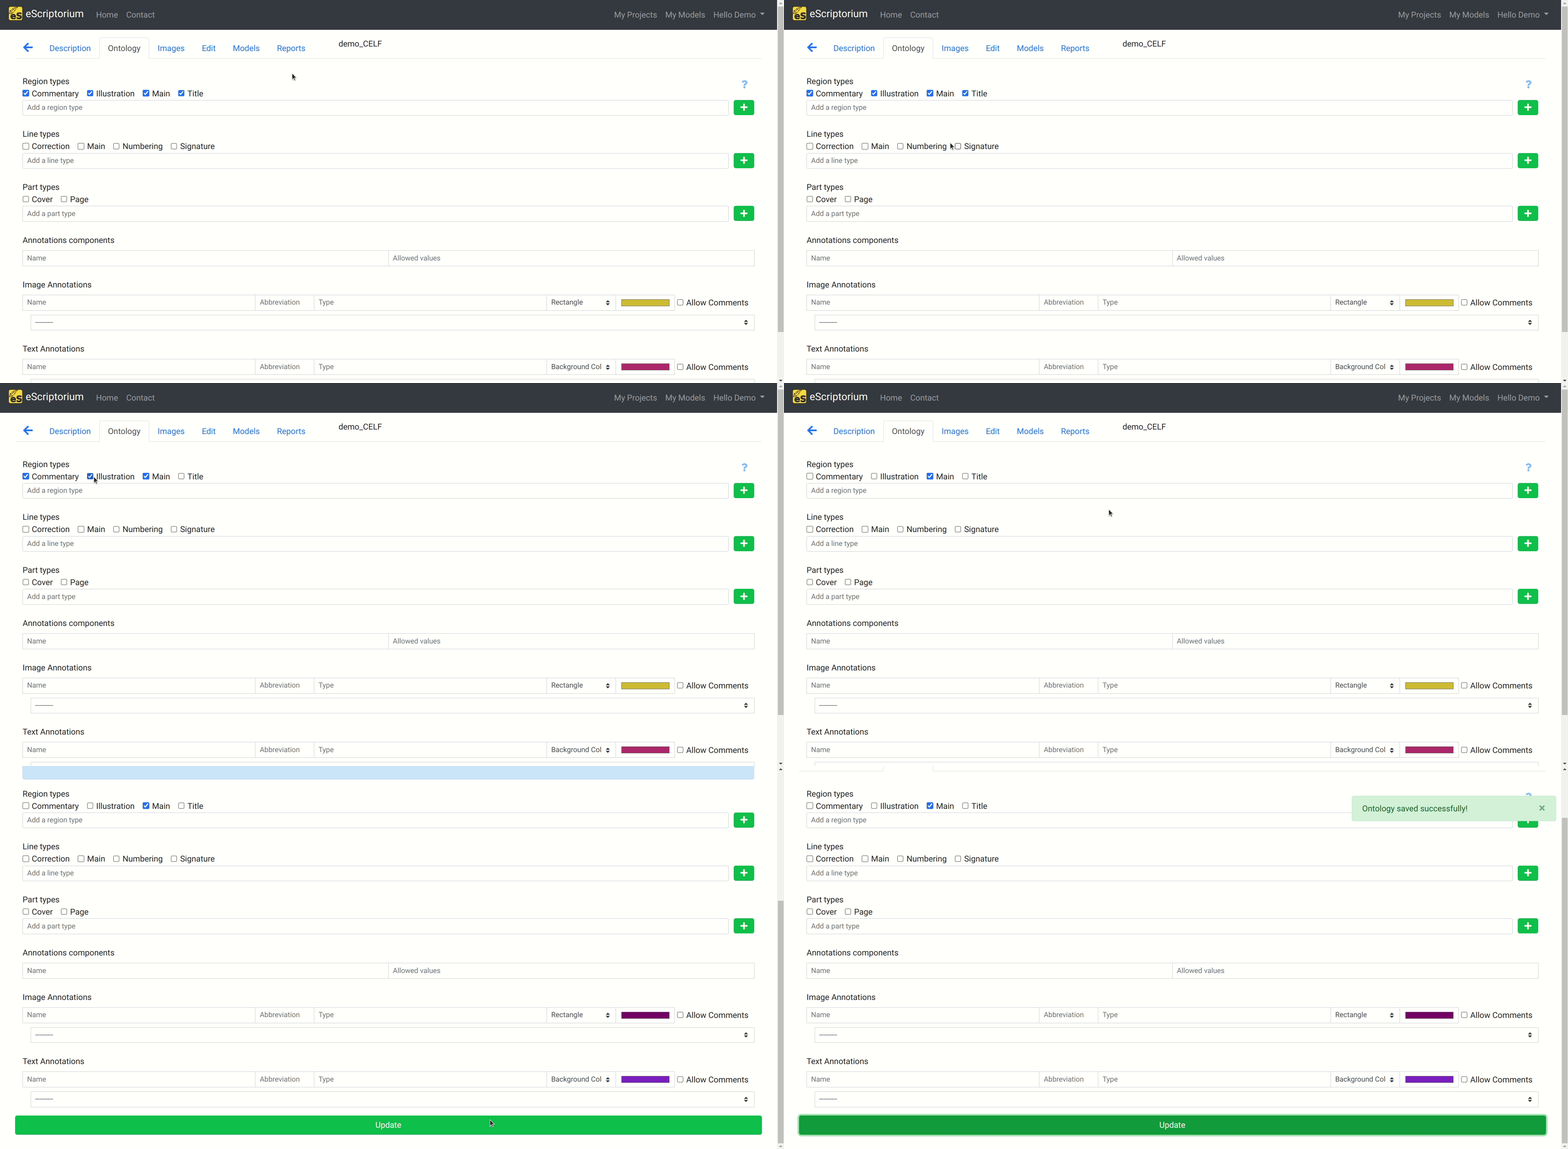
By default, eScriptorium documents are created with four active region types:
- Commentary
- Illustration
- Main
- Title
And four inactive line types:
- Correction
- Main
- Numbering
- Signature
You can use them or deactivate them to use your own. Simply check or uncheck the box next to a type to activate/deactivate it. Remember to click on the “Update” button to save the changes.
More region/line types
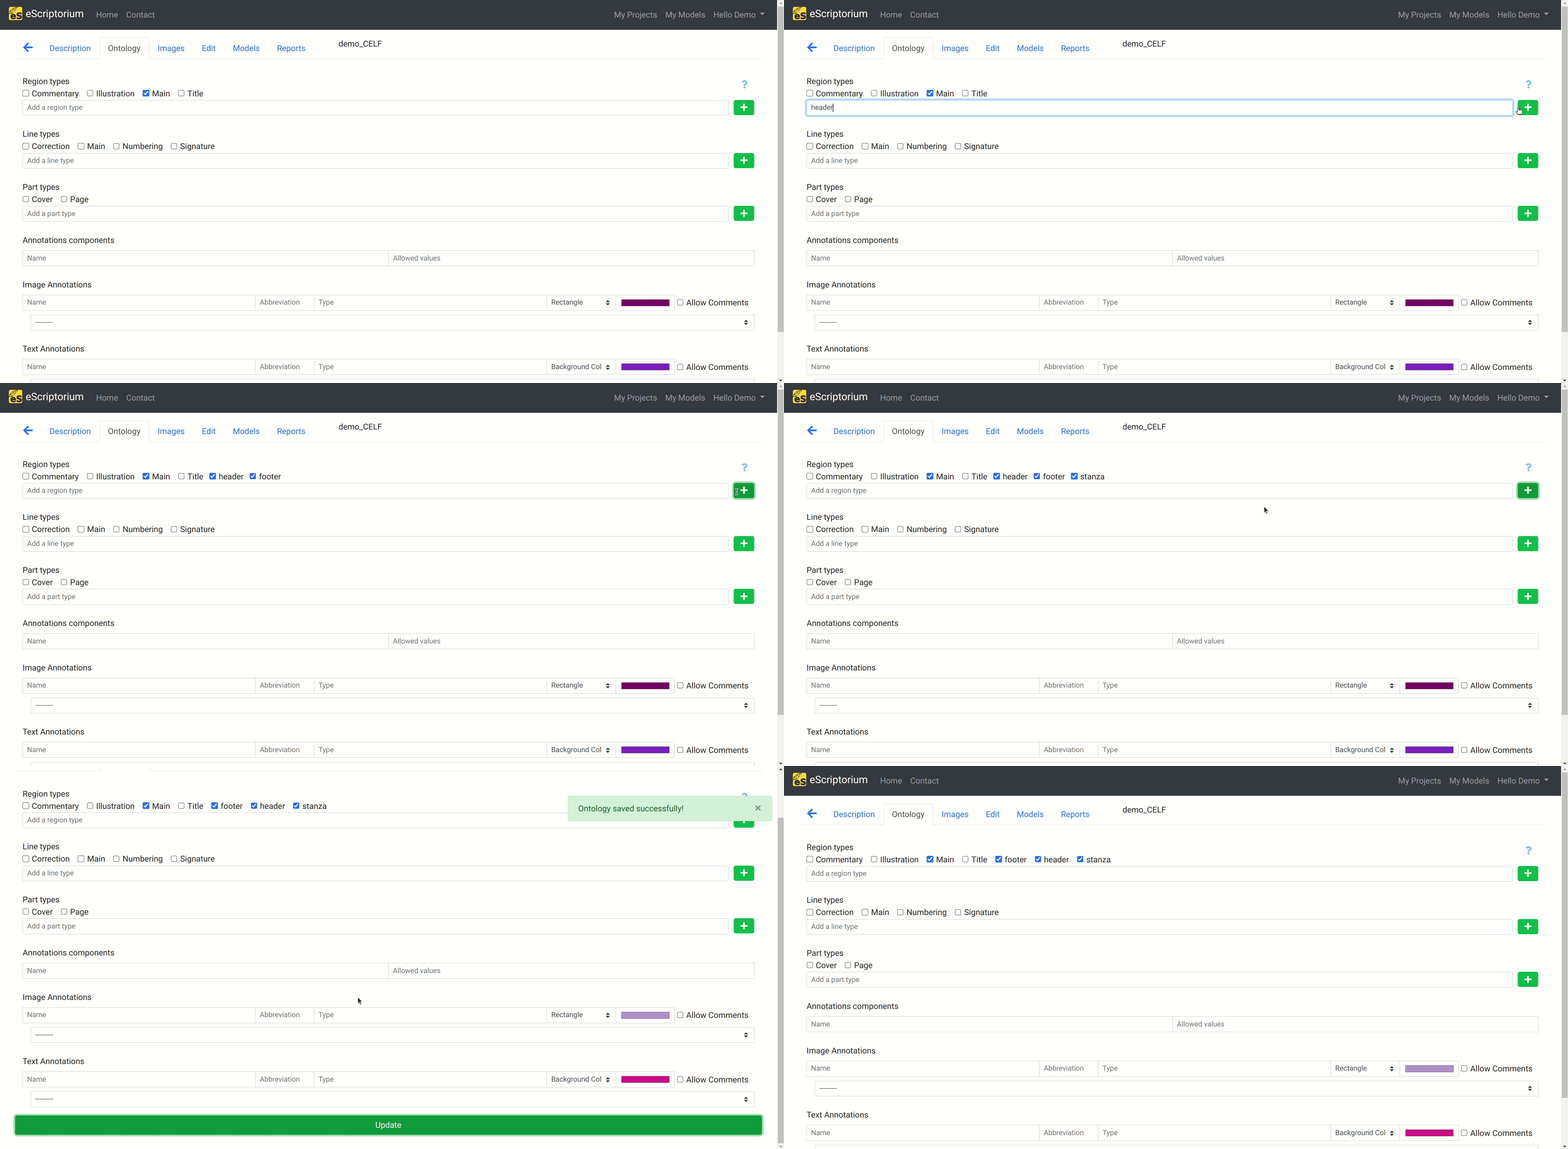
When you import the segmentation/transcription from XML files, new region and line types are created automatically to match the ontology used in the imported documents.
To create your own types, write the desired name for the new region in the dedicated field and then click on the + button. Again, remember to click on the “Update” button to save the changes.
Use SegmOnto
Efforts to homogenize the names of custom regions have lead to the creation of the SegmOnto vocabulary. On top of making your data compatible with others’, it will help you decide faster what types are commonly used for regions and lines.
Typing lines and regions
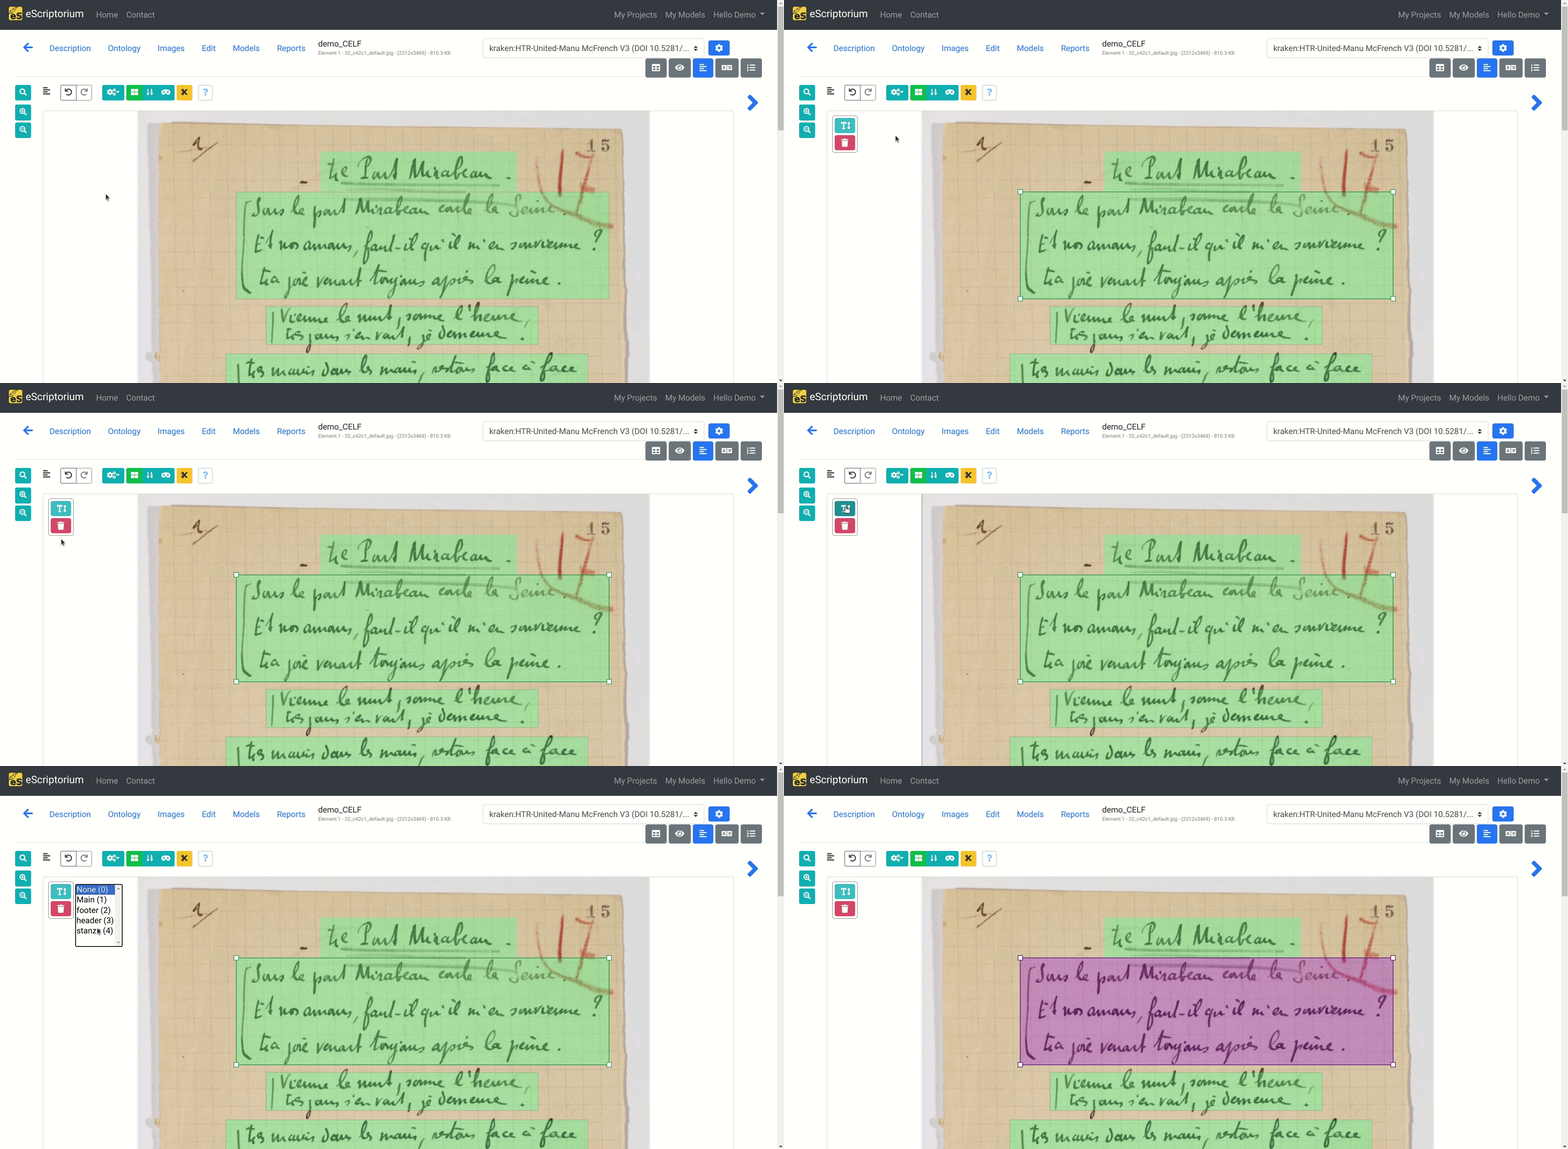
Back to the segmentation panel: you can add a label to a region or a line by clicking on them and then by clicking on the ‘Set the type on all selected lines/regions’ button, or by pressing T. A dropdown menu should appear with the custom labels you created, along with some custom shortcuts. Remember to toggle the region edition mode to assign types to regions!
Tip
You can change the color of a text region in eScriptorium in the images tab by clicking on editor settings.